Utters and Oats
*Featured in the Spring 2021 edition of Canadian Vegan magazine
Summary
This report contrasts the environmental impacts vegetarian and vegan dietary foods. The evaluation of eggs and milk in this study reveal that vegan alternatives, especially eggs, generally possess a lower environmental impact than vegetarian options.
Introduction
Veganism is often less accommodated in society than the vegetarian diet. The dietary inconvenience may, however, be tolerable if significant reductions in environmental impact existed with veganism relative to vegetarianism. This report investigates the environmental impacts of dairy and eggs relative to their vegan alternatives, which may advise people with the relative importance of the foods while following a sustainable lifestyle.
Results
The impact differences are presented in three sets of graphs. The impacts were calculated at different scales of the single serving size, which was 1 cup (245 grams) for the milks and 1 egg for both the chicken egg and the flax egg of Table 1. The graphs of Figures 1-3 depict the impact differences from consuming single servings of each food in pure metric units of L, m2, and kg CO2-eq. The graphs of Figures 4-6 depict the annual impacts from one daily serving in relatable units of filled bathtubs, city blocks, and km driven in a car. The graphs of Figures 7-9 depict the impacts for consuming a retail container of each food, which is 4 liters for the milks and a dozen for the eggs, in relatable units.
Table 1: Ingredients and quantities for the flaxseed egg.
| Ingredient | Quantities | Practical values | Vegan #1 |
|---|---|---|---|
| Total Flax seed egg | 51 g | 1 egg | 92.6% Met |
| -> Ground flax seeds | 7 g | 1 tablespoon | Met |
| -> Water | 44 g | 2% tablespoons | Met |
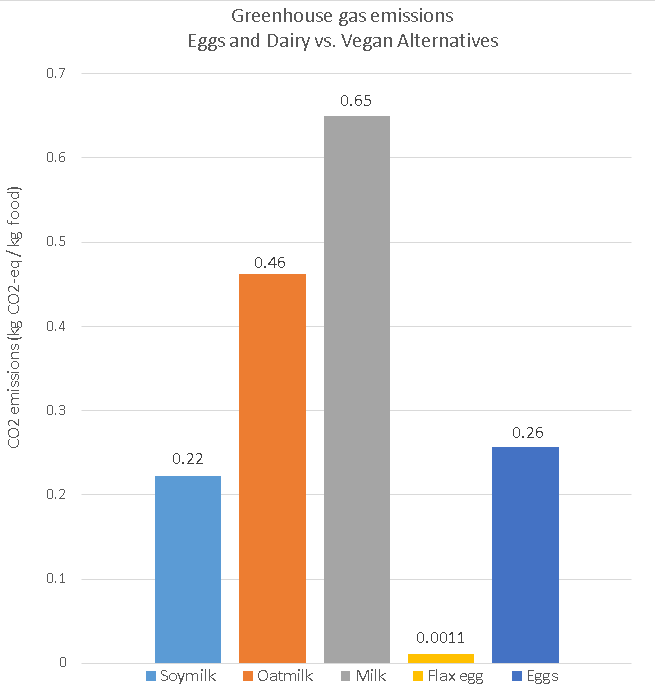
Figure 1: The greenhouse gas emissions of a single serving of each food.
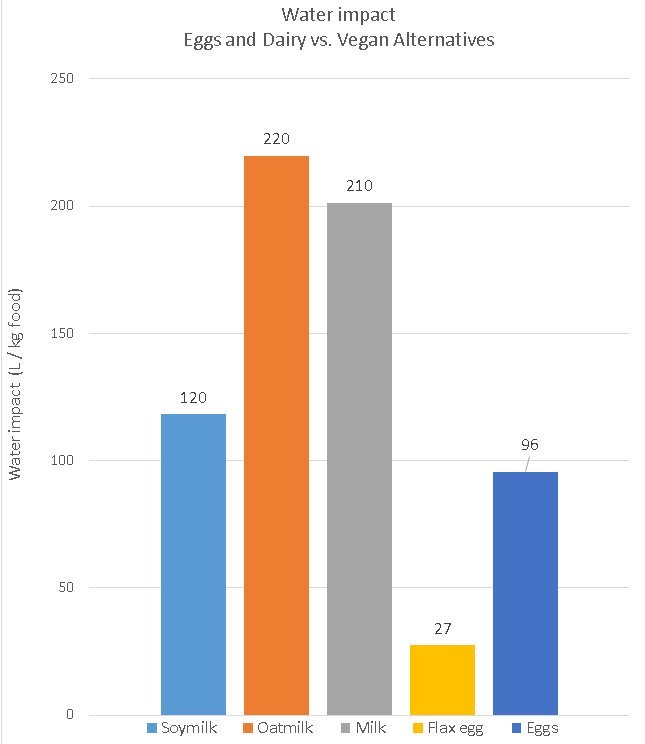
Figure 2: The water impacts of a single serving of each food.
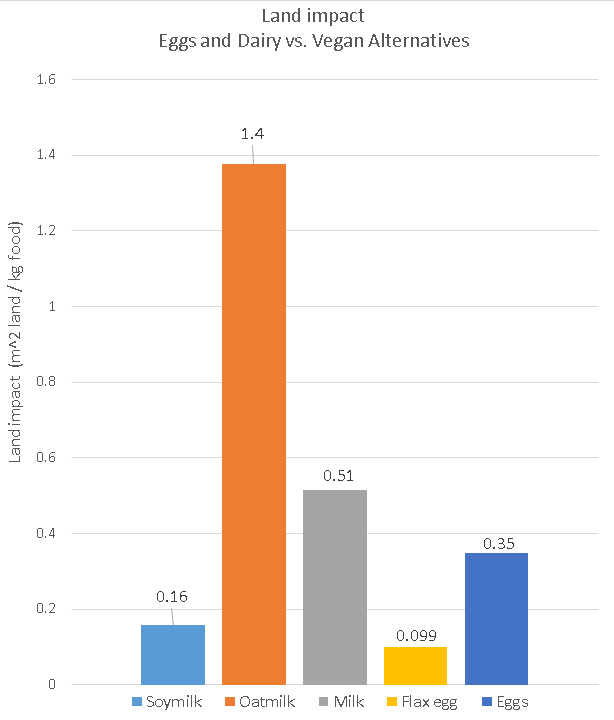
Figure 3: The land impact of a single serving of each food.

Figure 4: The annual greenhouse gas emissions as the equivalent of driving a vehicle the presented distance, from a single daily serving of each food.

Figure 5: The annual water impact as filled bathtubs from a single daily serving of each food.

Figure 6: The annual land impact as city blocks from a single daily serving of each food.

Figure 7: The greenhouse gas emission from a retail container quantity of each food: 4 liters of liquid or a dozen eggs.

Figure 8: The water impact from a retail container quantity of each food: 4 liters of liquid or a dozen eggs.

Figure 9: The land impact from a retail container quantity of each food: 4 liters of liquid or a dozen eggs.
Discussion
The calculated ranges were broad. Oatmilk, for example, required substantially more land than dairy milk while soymilk required substantially less land dairy milk. Soymilk further appears more sustainable than oatmilk by emitting less greenhouse gas emissions. The water and land impacts of oatmilk where greater than dairy milk, which may seem counterintuitive with vegan popular dogma, however, soymilk demonstrates that the exceptional impacts of oatmilk are unreflective of alternative milks in general. The impacts of water and land may furthermore be considered inferior to the impact of greenhouse gas emissions, in which case oatmilk may still be a more sustainable food than dairy milk. The flax egg was ubiquitously less impactful than the chicken egg, especially in reducing greenhouse gas emissions by ~30x.
Methods
Two environmental impact databases were used. The greenhouse gas and land emission data were sourced from a recent article in Science1, where dairy milk, chicken egg, and soymilk foods were directly described. Oatmilk was approximated from the oatmeal category by the 0.43$\frac{oats}{oatmeal}$i and by the 0.313$\frac{oats}{oatmeal}$ii conversions that yielded a ratio between the quantity of oats in oatmeal and in oatmilk. The flax egg was approximated as "Other Pulses". The water impact data was sourced from two recent studies2,3 that directly summarized each food except oatmilk, which was calculated as the product from the water impact of oats and the proportion oats in oatmilk: 0.313.
The relatable values were acquired by various sources. The average bath size of 113 L was averaged from published literature4 and colloquial values between 113 L and 115 L. The CO2-eq emissions of driving was acquired from a 8.887$\frac{kg CO2}{gallon gasoline}$ ratio by the EPA5 and the assumption of a car with the fuel efficiency of 9$\frac{L}{100 km}$ or 26$\frac{miles}{gallon}$. The land impact used a conversion of 1.544$\frac{city blocks}{hectare}$.
i. The ratio of uncooked oats to cooked oatmeal was determined from the USDA database.
ii. The ratio of oats to oatmilk was averaged from 1, 2, 3, and 4 website recipes of oatmilk.
References
- Poore, J. & Nemecek, T. Reducing food's environmental impacts through producers and consumers. Science (80-. ). 360, 987-992 (2018).
- Mekonnen, M. M. & Hoekstra, A. Y. The green, blue, and grey water footprint of crops and derived crop products. Hydrol. Earth Syst. Sci. 15, 1577-1600 (2011).
- Mekonnen, M. M. & Hoekstra, A. Y. A global assessment of the water footprint of farm animal products. Ecosystems 15, 401-415 (2012).
- Hall, M. J., Hooper, B. D. & Postle, S. M. Domestic per Capita Water Consumption in South West England. Water Environ. J. 2, 626-631 (1988).
- EPA. Greenhouse gas equivalencies calculator - calculations and references. https://www.epa.gov/energy/greenhouse-gases-equivalencies-calculator-calculations-and-references.